2025 Vancouver Real Estate Market Review
Greater Vancouver Market Update: December 2025
Simply put, 2025 has been a year of re-calibration. After a strong finish to 2024 and early optimism, the pace of sales in Metro Vancouver slowed relative to historical norms, and inventory steadily built up. Data reports throughout the year highlighted the same core trends: slower sales, higher listings, and a shift toward conditions that favour buyers more than sellers.
Use this link for The December Realtor Report from Greater Vancouver REALTORS®. Keep up-to-date with current stats every month on our website. https://www.krystianthomas.com/vancouver-real-estate-sales#
Historically Low Average Sales Activity
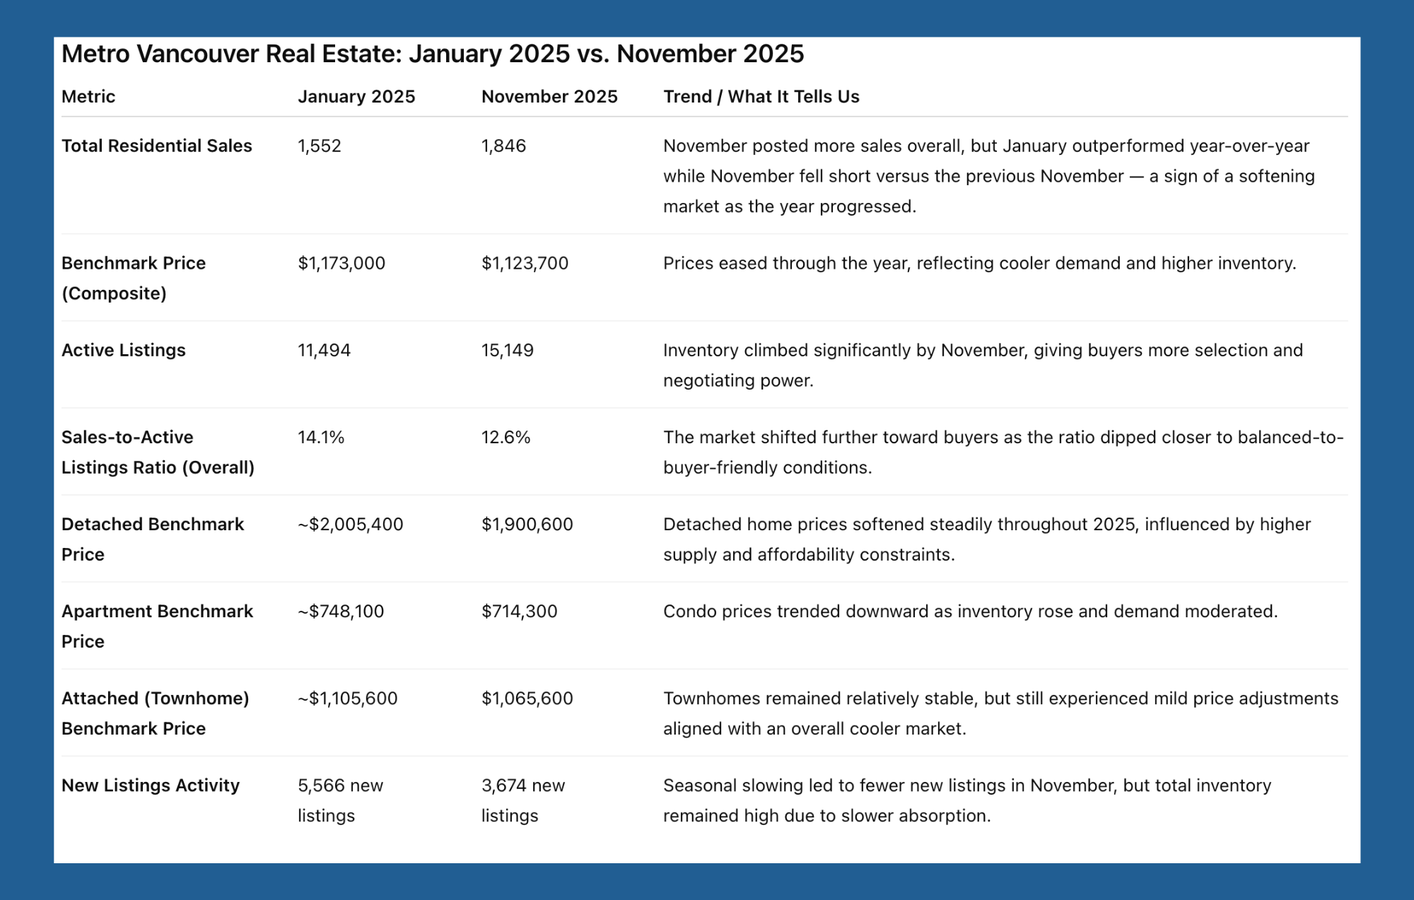
Sales Activity (January-November 2025): 1,552 →1,846
From the late spring through fall, home sales repeatedly came in lower than both the previous year and the long-term seasonal averages. October saw sales down compared with 2024, and that trend extended into November, with residential activity about 20+% below the 10-year seasonal averages.
That trend of weaker-than-average activity isn’t just a number — it’s a clear signal that buyer demand was measured rather than frenzied, and that many purchasers were waiting for the right opportunity rather than jumping in impulsively.
Historically High Inventory Levels
Active Listings (January-November 2025): 11,494 → 15,149
Higher inventory has meant:
- less urgency for buyers
- more negotiation space
- and a need for sellers to be realistic with pricing and presentation
Softened and Stabilized Prices
Benchmark Prices (January-November 2025):
- Benchmark Price Composite: $1.17M → $1.12M
- Detached Sales Price: ~$2.0M → ~$1.90M
- Apartment Price: ~$748K → ~$714K
- Townhomes: ~$1.11M → ~$1.07M
In key segments — detached, townhomes, and apartments — benchmark prices eased modestly through 2025. This wasn’t a dramatic collapse; it was a steady, controlled softening that reflected the slower pace of transactions and the elevated choice available to buyers.
More homes on the market plus careful, deliberate buyer behaviour translated into pricing that increasingly reflected today’s conditions rather than the peak market dynamics of recent years.
Buyer-Friendly Sales-to-Active-Listings Ratio
Sales-to-Active Ratio (January-November 2025): 14.1% → 12.6%
Throughout the year, the sales-to-active-listings ratio frequently hovered in ranges that traditionally lean toward buyers rather than sellers. When this ratio stays low over a sustained period, it tends to signal downward pressure on prices and a shift in negotiating power toward those buying. In November, for example, the ratio dipped below historical balance points across property types, landing in balanced but buyer-friendly territory.
Metro Vancouver 2025 Market Takeaways
- Buyers were cautious but competitive when conditions matched value.
- Sellers who adapted their pricing and expectations found interest and movement.
- The market overall drifted toward balance — not boom, not bust — but steady and thoughtful.
Looking Ahead
As we enter 2026, the groundwork laid this year suggests a more balanced market continuing into the new year. If inventory continues to normalize and buyer confidence strengthens — whether through interest rate stability or improved affordability — we could see more momentum in sales activity without the pressure cooker dynamics of the market’s past cycles.2025 was a year in which the market slowed — and that sets the stage for a more deliberate, sustainable housing market going forward.
Source: Greater Vancouver REALTORS®.
